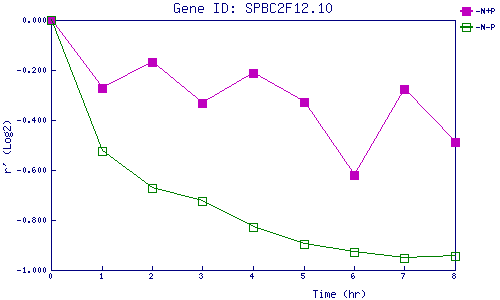
| 0 | 1 | 2 | 3 | 4 | 5 | 6 | 7 | 8 | |
| -N+P | 0.000 | -0.270 | -0.167 | -0.332 | -0.213 | -0.327 | -0.619 | -0.275 | -0.489 |
| -N-P | 0.000 | -0.524 | -0.673 | -0.725 | -0.829 | -0.894 | -0.930 | -0.952 | -0.944 |
|
-N+P: Nitrogen starved in the presence of P-factor -N-P: Nitrogen starved in the absence of P-factor |