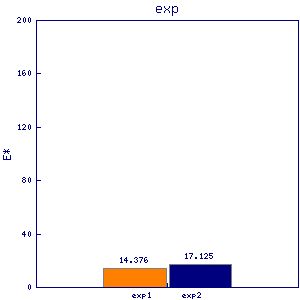
rep2
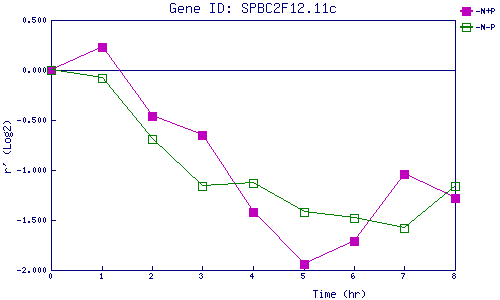
| 0 | 1 | 2 | 3 | 4 | 5 | 6 | 7 | 8 | |
| -N+P | 0.000 | 0.226 | -0.460 | -0.648 | -1.420 | -1.937 | -1.710 | -1.042 | -1.278 |
| -N-P | 0.000 | -0.078 | -0.689 | -1.164 | -1.134 | -1.417 | -1.482 | -1.586 | -1.162 |
|
-N+P: Nitrogen starved in the presence of P-factor -N-P: Nitrogen starved in the absence of P-factor |