gua1
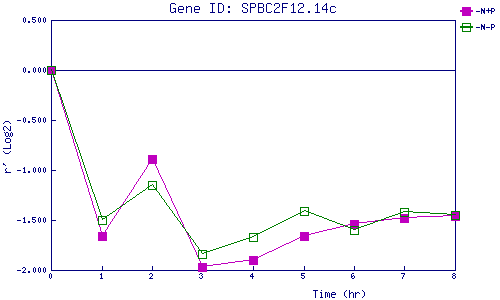
| 0 | 1 | 2 | 3 | 4 | 5 | 6 | 7 | 8 | |
| -N+P | 0.000 | -1.657 | -0.891 | -1.974 | -1.898 | -1.659 | -1.540 | -1.482 | -1.463 |
| -N-P | 0.000 | -1.502 | -1.148 | -1.842 | -1.667 | -1.408 | -1.598 | -1.417 | -1.446 |
|
-N+P: Nitrogen starved in the presence of P-factor -N-P: Nitrogen starved in the absence of P-factor |