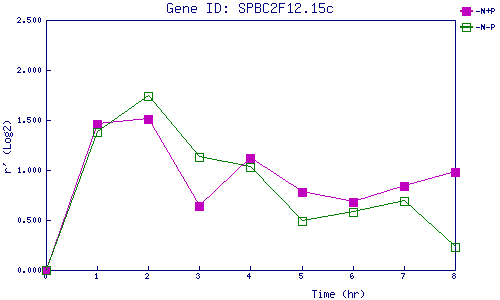
| 0 | 1 | 2 | 3 | 4 | 5 | 6 | 7 | 8 | |
| -N+P | 0.000 | 1.455 | 1.508 | 0.640 | 1.119 | 0.783 | 0.675 | 0.837 | 0.981 |
| -N-P | 0.000 | 1.378 | 1.745 | 1.127 | 1.028 | 0.492 | 0.585 | 0.691 | 0.231 |
|
-N+P: Nitrogen starved in the presence of P-factor -N-P: Nitrogen starved in the absence of P-factor |
| Gene | ||||||||||||||||||||||||||||||
| Gene expression upon nitrogen starvation | ||||||||||||||||||||||||||||||
|
||||||||||||||||||||||||||||||
|
|
||||||||||||||||||||||||||||||
| Values plotted in the graph | ||||||||||||||||||||||||||||||
|
|
||||||||||||||||||||||||||||||
|
||||||||||||||||||||||||||||||
| Number of mRNA in a vegetative growing cell (estimated roughly) | ||||||||||||||||||||||||||||||
|
|
||||||||||||||||||||||||||||||
|
|
||||||||||||||||||||||||||||||