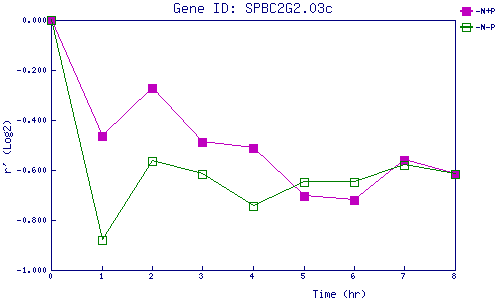
| 0 | 1 | 2 | 3 | 4 | 5 | 6 | 7 | 8 | |
| -N+P | 0.000 | -0.462 | -0.270 | -0.488 | -0.513 | -0.702 | -0.722 | -0.560 | -0.616 |
| -N-P | 0.000 | -0.880 | -0.564 | -0.618 | -0.742 | -0.647 | -0.650 | -0.579 | -0.615 |
|
-N+P: Nitrogen starved in the presence of P-factor -N-P: Nitrogen starved in the absence of P-factor |