rpl16c rpl1603
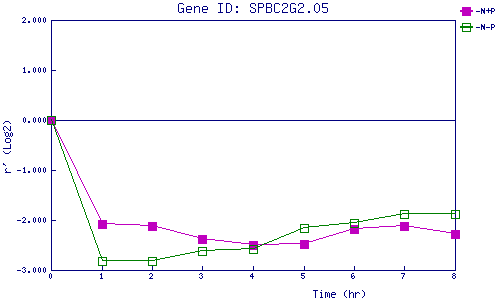
| 0 | 1 | 2 | 3 | 4 | 5 | 6 | 7 | 8 | |
| -N+P | 0.000 | -2.077 | -2.122 | -2.377 | -2.507 | -2.473 | -2.177 | -2.118 | -2.279 |
| -N-P | 0.000 | -2.811 | -2.827 | -2.627 | -2.585 | -2.167 | -2.065 | -1.877 | -1.871 |
|
-N+P: Nitrogen starved in the presence of P-factor -N-P: Nitrogen starved in the absence of P-factor |