ade9
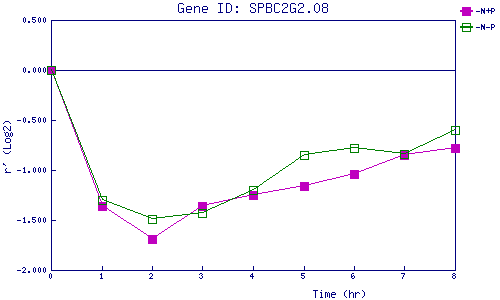
| 0 | 1 | 2 | 3 | 4 | 5 | 6 | 7 | 8 | |
| -N+P | 0.000 | -1.355 | -1.692 | -1.360 | -1.246 | -1.157 | -1.045 | -0.853 | -0.779 |
| -N-P | 0.000 | -1.305 | -1.488 | -1.432 | -1.201 | -0.848 | -0.775 | -0.840 | -0.603 |
|
-N+P: Nitrogen starved in the presence of P-factor -N-P: Nitrogen starved in the absence of P-factor |