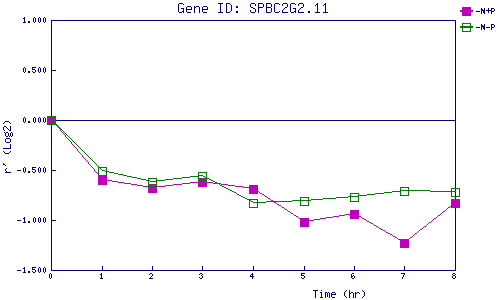
| 0 | 1 | 2 | 3 | 4 | 5 | 6 | 7 | 8 | |
| -N+P | 0.000 | -0.604 | -0.684 | -0.625 | -0.690 | -1.021 | -0.940 | -1.234 | -0.833 |
| -N-P | 0.000 | -0.511 | -0.621 | -0.560 | -0.828 | -0.806 | -0.769 | -0.711 | -0.715 |
|
-N+P: Nitrogen starved in the presence of P-factor -N-P: Nitrogen starved in the absence of P-factor |