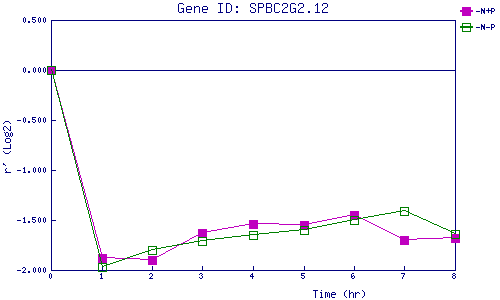
| 0 | 1 | 2 | 3 | 4 | 5 | 6 | 7 | 8 | |
| -N+P | 0.000 | -1.879 | -1.900 | -1.633 | -1.545 | -1.546 | -1.450 | -1.702 | -1.677 |
| -N-P | 0.000 | -1.971 | -1.797 | -1.707 | -1.652 | -1.597 | -1.500 | -1.411 | -1.641 |
|
-N+P: Nitrogen starved in the presence of P-factor -N-P: Nitrogen starved in the absence of P-factor |