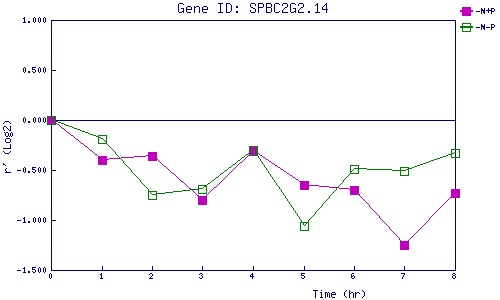
| 0 | 1 | 2 | 3 | 4 | 5 | 6 | 7 | 8 | |
| -N+P | 0.000 | -0.403 | -0.361 | -0.801 | -0.307 | -0.653 | -0.695 | -1.252 | -0.727 |
| -N-P | 0.000 | -0.188 | -0.753 | -0.688 | -0.302 | -1.065 | -0.493 | -0.514 | -0.330 |
|
-N+P: Nitrogen starved in the presence of P-factor -N-P: Nitrogen starved in the absence of P-factor |