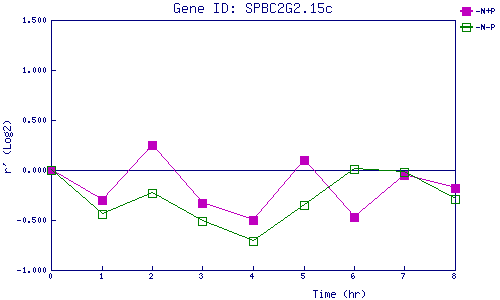
| 0 | 1 | 2 | 3 | 4 | 5 | 6 | 7 | 8 | |
| -N+P | 0.000 | -0.302 | 0.252 | -0.328 | -0.505 | 0.104 | -0.471 | -0.052 | -0.177 |
| -N-P | 0.000 | -0.435 | -0.232 | -0.511 | -0.706 | -0.350 | 0.008 | -0.017 | -0.287 |
|
-N+P: Nitrogen starved in the presence of P-factor -N-P: Nitrogen starved in the absence of P-factor |