| 0 | 1 | 2 | 3 | 4 | 5 | 6 | 7 | 8 | |
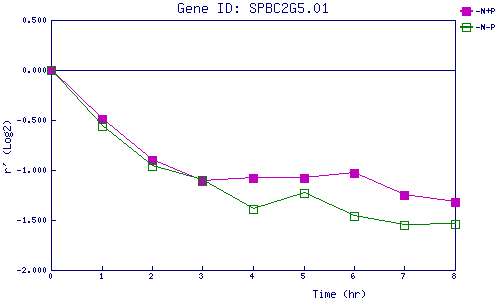
| -N+P | 0.000 | -0.490 | -0.896 | -1.113 | -1.078 | -1.076 | -1.034 | -1.248 | -1.315 |
| -N-P | 0.000 | -0.565 | -0.961 | -1.099 | -1.394 | -1.227 | -1.456 | -1.551 | -1.541 |
|
-N+P: Nitrogen starved in the presence of P-factor -N-P: Nitrogen starved in the absence of P-factor |