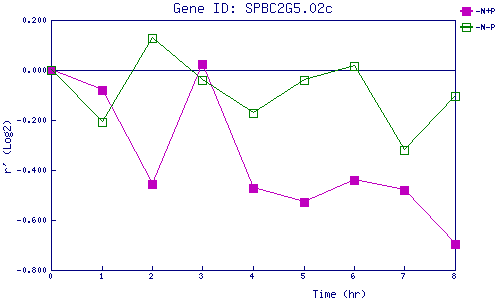
| 0 | 1 | 2 | 3 | 4 | 5 | 6 | 7 | 8 | |
| -N+P | 0.000 | -0.079 | -0.458 | 0.026 | -0.473 | -0.527 | -0.442 | -0.479 | -0.694 |
| -N-P | 0.000 | -0.208 | 0.128 | -0.040 | -0.171 | -0.040 | 0.017 | -0.321 | -0.102 |
|
-N+P: Nitrogen starved in the presence of P-factor -N-P: Nitrogen starved in the absence of P-factor |