| 0 | 1 | 2 | 3 | 4 | 5 | 6 | 7 | 8 | |
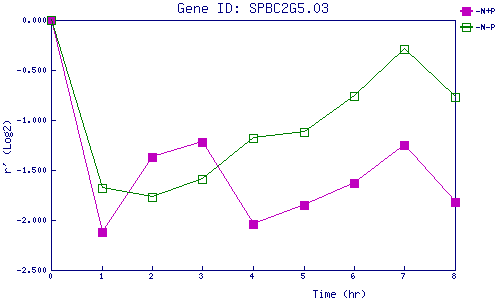
| -N+P | 0.000 | -2.124 | -1.374 | -1.225 | -2.044 | -1.854 | -1.631 | -1.248 | -1.817 |
| -N-P | 0.000 | -1.679 | -1.773 | -1.592 | -1.185 | -1.125 | -0.765 | -0.290 | -0.771 |
|
-N+P: Nitrogen starved in the presence of P-factor -N-P: Nitrogen starved in the absence of P-factor |
