rpc25
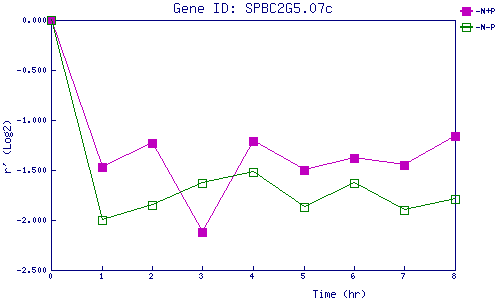
| 0 | 1 | 2 | 3 | 4 | 5 | 6 | 7 | 8 | |
| -N+P | 0.000 | -1.467 | -1.230 | -2.115 | -1.210 | -1.503 | -1.375 | -1.446 | -1.156 |
| -N-P | 0.000 | -2.002 | -1.849 | -1.632 | -1.521 | -1.866 | -1.629 | -1.899 | -1.794 |
|
-N+P: Nitrogen starved in the presence of P-factor -N-P: Nitrogen starved in the absence of P-factor |