| 0 | 1 | 2 | 3 | 4 | 5 | 6 | 7 | 8 | |
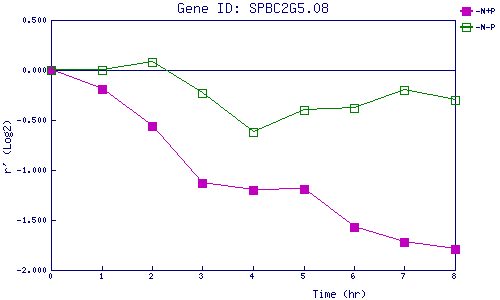
| -N+P | 0.000 | -0.190 | -0.562 | -1.130 | -1.204 | -1.186 | -1.572 | -1.722 | -1.793 |
| -N-P | 0.000 | -0.002 | 0.082 | -0.230 | -0.622 | -0.399 | -0.380 | -0.202 | -0.300 |
|
-N+P: Nitrogen starved in the presence of P-factor -N-P: Nitrogen starved in the absence of P-factor |