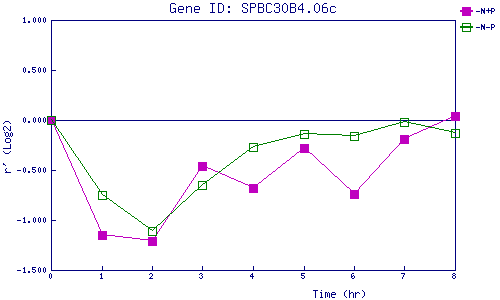
| 0 | 1 | 2 | 3 | 4 | 5 | 6 | 7 | 8 | |
| -N+P | 0.000 | -1.147 | -1.210 | -0.459 | -0.685 | -0.279 | -0.744 | -0.189 | 0.038 |
| -N-P | 0.000 | -0.747 | -1.108 | -0.648 | -0.266 | -0.139 | -0.155 | -0.020 | -0.128 |
|
-N+P: Nitrogen starved in the presence of P-factor -N-P: Nitrogen starved in the absence of P-factor |