tfb4
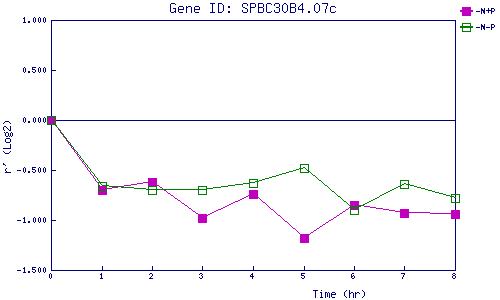
| 0 | 1 | 2 | 3 | 4 | 5 | 6 | 7 | 8 | |
| -N+P | 0.000 | -0.704 | -0.615 | -0.982 | -0.738 | -1.176 | -0.849 | -0.928 | -0.939 |
| -N-P | 0.000 | -0.660 | -0.703 | -0.701 | -0.632 | -0.485 | -0.896 | -0.643 | -0.780 |
|
-N+P: Nitrogen starved in the presence of P-factor -N-P: Nitrogen starved in the absence of P-factor |