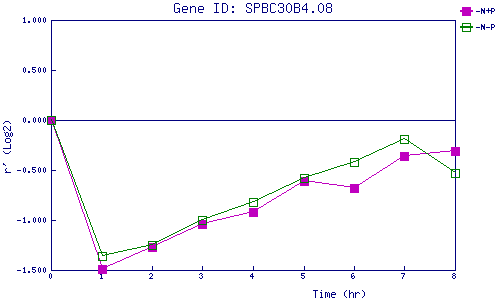
| 0 | 1 | 2 | 3 | 4 | 5 | 6 | 7 | 8 | |
| -N+P | 0.000 | -1.486 | -1.269 | -1.044 | -0.917 | -0.606 | -0.684 | -0.356 | -0.311 |
| -N-P | 0.000 | -1.360 | -1.253 | -0.996 | -0.825 | -0.580 | -0.416 | -0.187 | -0.534 |
|
-N+P: Nitrogen starved in the presence of P-factor -N-P: Nitrogen starved in the absence of P-factor |