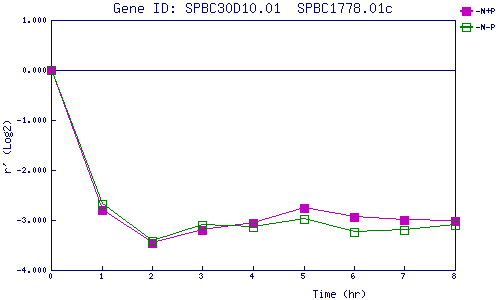
| 0 | 1 | 2 | 3 | 4 | 5 | 6 | 7 | 8 | |
| -N+P | 0.000 | -2.802 | -3.467 | -3.197 | -3.060 | -2.752 | -2.938 | -3.007 | -3.021 |
| -N-P | 0.000 | -2.686 | -3.429 | -3.108 | -3.142 | -2.978 | -3.231 | -3.208 | -3.105 |
|
-N+P: Nitrogen starved in the presence of P-factor -N-P: Nitrogen starved in the absence of P-factor |