| 0 | 1 | 2 | 3 | 4 | 5 | 6 | 7 | 8 | |
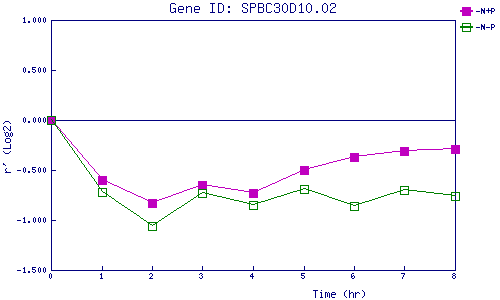
| -N+P | 0.000 | -0.602 | -0.829 | -0.653 | -0.733 | -0.501 | -0.371 | -0.309 | -0.286 |
| -N-P | 0.000 | -0.721 | -1.063 | -0.729 | -0.849 | -0.690 | -0.862 | -0.699 | -0.763 |
|
-N+P: Nitrogen starved in the presence of P-factor -N-P: Nitrogen starved in the absence of P-factor |