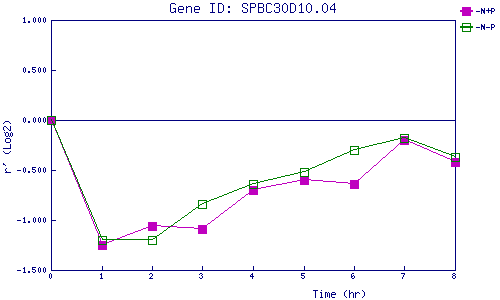
| 0 | 1 | 2 | 3 | 4 | 5 | 6 | 7 | 8 | |
| -N+P | 0.000 | -1.248 | -1.064 | -1.090 | -0.702 | -0.604 | -0.644 | -0.198 | -0.422 |
| -N-P | 0.000 | -1.203 | -1.196 | -0.840 | -0.644 | -0.523 | -0.300 | -0.177 | -0.366 |
|
-N+P: Nitrogen starved in the presence of P-factor -N-P: Nitrogen starved in the absence of P-factor |