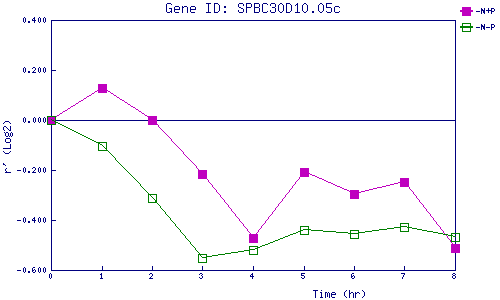
| 0 | 1 | 2 | 3 | 4 | 5 | 6 | 7 | 8 | |
| -N+P | 0.000 | 0.130 | 0.001 | -0.215 | -0.470 | -0.208 | -0.295 | -0.249 | -0.512 |
| -N-P | 0.000 | -0.104 | -0.314 | -0.552 | -0.519 | -0.440 | -0.454 | -0.428 | -0.467 |
|
-N+P: Nitrogen starved in the presence of P-factor -N-P: Nitrogen starved in the absence of P-factor |