lsm4
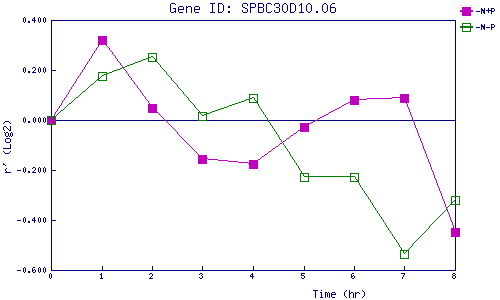
| 0 | 1 | 2 | 3 | 4 | 5 | 6 | 7 | 8 | |
| -N+P | 0.000 | 0.321 | 0.047 | -0.157 | -0.176 | -0.027 | 0.081 | 0.088 | -0.448 |
| -N-P | 0.000 | 0.177 | 0.251 | 0.018 | 0.086 | -0.228 | -0.229 | -0.535 | -0.321 |
|
-N+P: Nitrogen starved in the presence of P-factor -N-P: Nitrogen starved in the absence of P-factor |