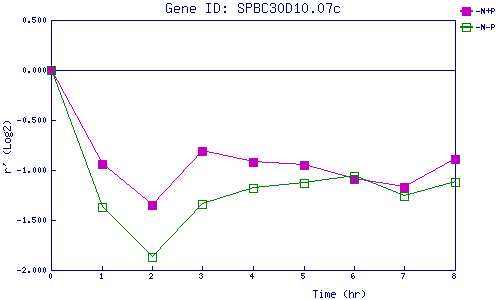
| 0 | 1 | 2 | 3 | 4 | 5 | 6 | 7 | 8 | |
| -N+P | 0.000 | -0.944 | -1.352 | -0.812 | -0.924 | -0.953 | -1.094 | -1.174 | -0.886 |
| -N-P | 0.000 | -1.368 | -1.869 | -1.344 | -1.177 | -1.127 | -1.062 | -1.257 | -1.120 |
|
-N+P: Nitrogen starved in the presence of P-factor -N-P: Nitrogen starved in the absence of P-factor |