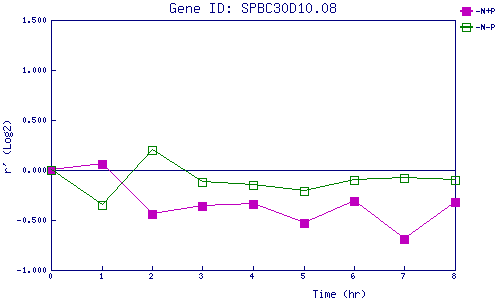
| 0 | 1 | 2 | 3 | 4 | 5 | 6 | 7 | 8 | |
| -N+P | 0.000 | 0.057 | -0.443 | -0.357 | -0.340 | -0.530 | -0.308 | -0.686 | -0.321 |
| -N-P | 0.000 | -0.352 | 0.202 | -0.119 | -0.154 | -0.214 | -0.104 | -0.076 | -0.100 |
|
-N+P: Nitrogen starved in the presence of P-factor -N-P: Nitrogen starved in the absence of P-factor |