gpi1
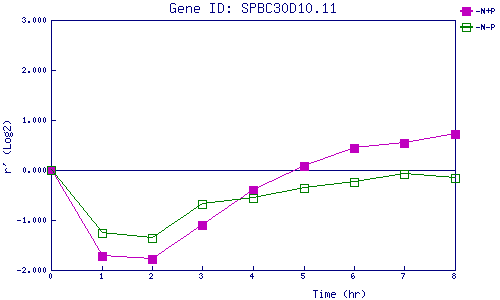
| 0 | 1 | 2 | 3 | 4 | 5 | 6 | 7 | 8 | |
| -N+P | 0.000 | -1.712 | -1.777 | -1.099 | -0.390 | 0.090 | 0.441 | 0.549 | 0.716 |
| -N-P | 0.000 | -1.264 | -1.350 | -0.686 | -0.557 | -0.354 | -0.236 | -0.074 | -0.167 |
|
-N+P: Nitrogen starved in the presence of P-factor -N-P: Nitrogen starved in the absence of P-factor |