pdb1
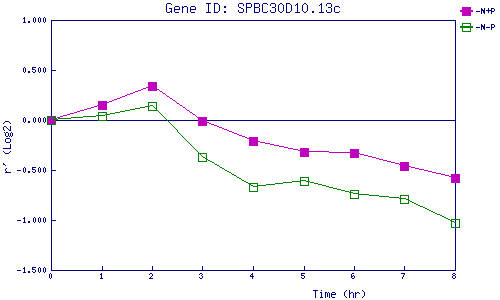
| 0 | 1 | 2 | 3 | 4 | 5 | 6 | 7 | 8 | |
| -N+P | 0.000 | 0.150 | 0.345 | -0.014 | -0.206 | -0.322 | -0.328 | -0.460 | -0.584 |
| -N-P | 0.000 | 0.037 | 0.138 | -0.373 | -0.670 | -0.612 | -0.744 | -0.786 | -1.027 |
|
-N+P: Nitrogen starved in the presence of P-factor -N-P: Nitrogen starved in the absence of P-factor |