| 0 | 1 | 2 | 3 | 4 | 5 | 6 | 7 | 8 | |
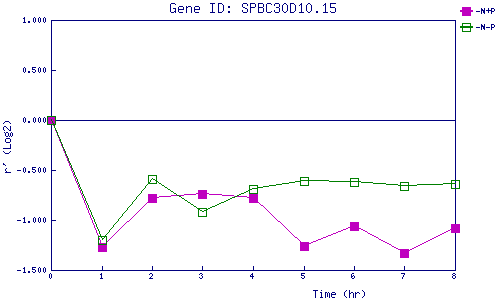
| -N+P | 0.000 | -1.271 | -0.781 | -0.737 | -0.779 | -1.259 | -1.057 | -1.332 | -1.080 |
| -N-P | 0.000 | -1.196 | -0.586 | -0.923 | -0.691 | -0.606 | -0.621 | -0.655 | -0.641 |
|
-N+P: Nitrogen starved in the presence of P-factor -N-P: Nitrogen starved in the absence of P-factor |