| 0 | 1 | 2 | 3 | 4 | 5 | 6 | 7 | 8 | |
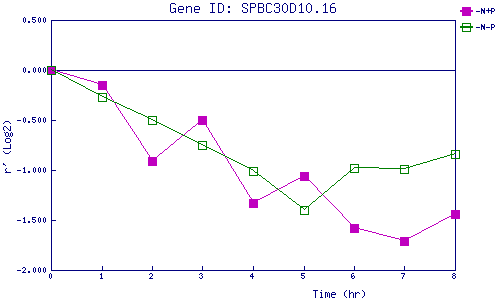
| -N+P | 0.000 | -0.146 | -0.908 | -0.497 | -1.331 | -1.062 | -1.575 | -1.710 | -1.441 |
| -N-P | 0.000 | -0.273 | -0.500 | -0.748 | -1.011 | -1.396 | -0.977 | -0.994 | -0.843 |
|
-N+P: Nitrogen starved in the presence of P-factor -N-P: Nitrogen starved in the absence of P-factor |