rpl1-2 rpl10a-2 rpl102 rpl102 rpl1-2 rpl10a-2
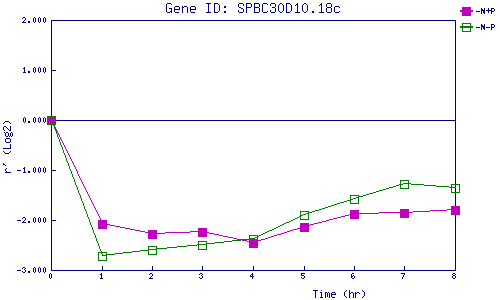
| 0 | 1 | 2 | 3 | 4 | 5 | 6 | 7 | 8 | |
| -N+P | 0.000 | -2.089 | -2.272 | -2.248 | -2.451 | -2.135 | -1.882 | -1.862 | -1.808 |
| -N-P | 0.000 | -2.726 | -2.610 | -2.507 | -2.376 | -1.896 | -1.572 | -1.290 | -1.360 |
|
-N+P: Nitrogen starved in the presence of P-factor -N-P: Nitrogen starved in the absence of P-factor |