pvg4
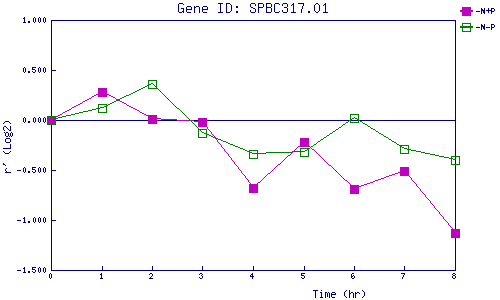
| 0 | 1 | 2 | 3 | 4 | 5 | 6 | 7 | 8 | |
| -N+P | 0.000 | 0.284 | 0.012 | -0.019 | -0.684 | -0.225 | -0.688 | -0.510 | -1.126 |
| -N-P | 0.000 | 0.119 | 0.356 | -0.128 | -0.344 | -0.317 | 0.023 | -0.288 | -0.396 |
|
-N+P: Nitrogen starved in the presence of P-factor -N-P: Nitrogen starved in the absence of P-factor |