pgak2
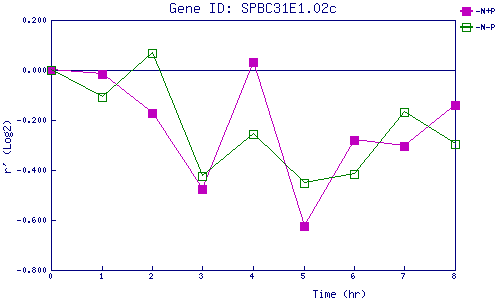
| 0 | 1 | 2 | 3 | 4 | 5 | 6 | 7 | 8 | |
| -N+P | 0.000 | -0.014 | -0.172 | -0.477 | 0.030 | -0.626 | -0.281 | -0.303 | -0.140 |
| -N-P | 0.000 | -0.108 | 0.068 | -0.424 | -0.255 | -0.453 | -0.414 | -0.170 | -0.298 |
|
-N+P: Nitrogen starved in the presence of P-factor -N-P: Nitrogen starved in the absence of P-factor |