ubl4
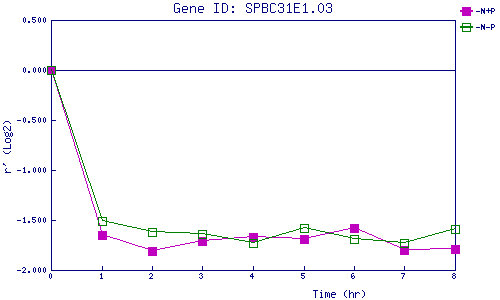
| 0 | 1 | 2 | 3 | 4 | 5 | 6 | 7 | 8 | |
| -N+P | 0.000 | -1.648 | -1.806 | -1.708 | -1.673 | -1.693 | -1.576 | -1.805 | -1.792 |
| -N-P | 0.000 | -1.506 | -1.624 | -1.638 | -1.726 | -1.586 | -1.689 | -1.729 | -1.590 |
|
-N+P: Nitrogen starved in the presence of P-factor -N-P: Nitrogen starved in the absence of P-factor |