| 0 | 1 | 2 | 3 | 4 | 5 | 6 | 7 | 8 | |
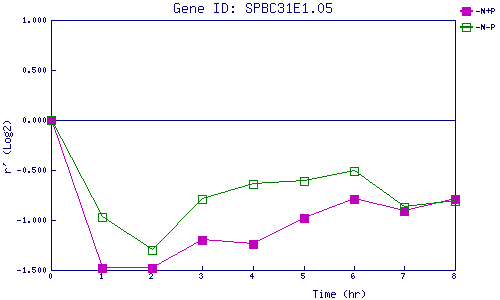
| -N+P | 0.000 | -1.483 | -1.475 | -1.195 | -1.244 | -0.980 | -0.786 | -0.911 | -0.788 |
| -N-P | 0.000 | -0.972 | -1.298 | -0.792 | -0.636 | -0.607 | -0.511 | -0.871 | -0.809 |
|
-N+P: Nitrogen starved in the presence of P-factor -N-P: Nitrogen starved in the absence of P-factor |