srb4
| 0 | 1 | 2 | 3 | 4 | 5 | 6 | 7 | 8 | |
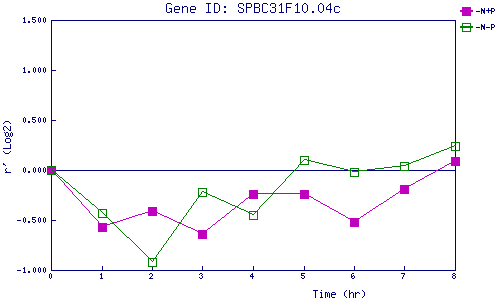
| -N+P | 0.000 | -0.570 | -0.410 | -0.639 | -0.244 | -0.241 | -0.520 | -0.189 | 0.092 |
| -N-P | 0.000 | -0.432 | -0.917 | -0.222 | -0.449 | 0.105 | -0.019 | 0.039 | 0.236 |
|
-N+P: Nitrogen starved in the presence of P-factor -N-P: Nitrogen starved in the absence of P-factor |
