mde2
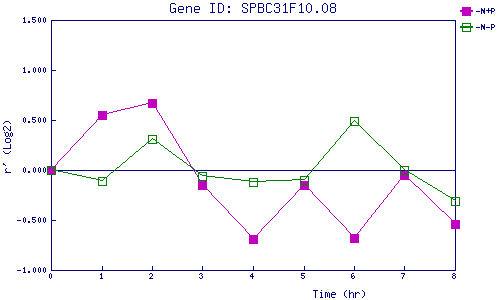
| 0 | 1 | 2 | 3 | 4 | 5 | 6 | 7 | 8 | |
| -N+P | 0.000 | 0.551 | 0.666 | -0.147 | -0.694 | -0.152 | -0.684 | -0.047 | -0.544 |
| -N-P | 0.000 | -0.107 | 0.310 | -0.058 | -0.125 | -0.105 | 0.491 | 0.000 | -0.311 |
|
-N+P: Nitrogen starved in the presence of P-factor -N-P: Nitrogen starved in the absence of P-factor |