cwf4 syf3
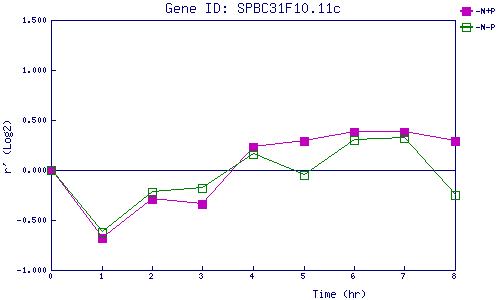
| 0 | 1 | 2 | 3 | 4 | 5 | 6 | 7 | 8 | |
| -N+P | 0.000 | -0.675 | -0.288 | -0.335 | 0.232 | 0.289 | 0.384 | 0.377 | 0.286 |
| -N-P | 0.000 | -0.621 | -0.216 | -0.183 | 0.162 | -0.049 | 0.300 | 0.315 | -0.246 |
|
-N+P: Nitrogen starved in the presence of P-factor -N-P: Nitrogen starved in the absence of P-factor |