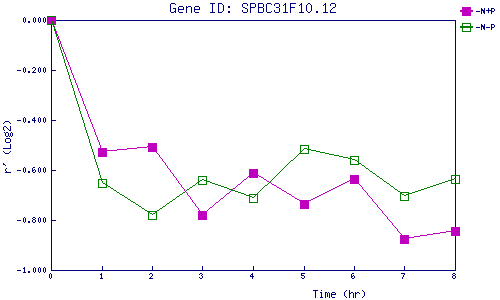
| 0 | 1 | 2 | 3 | 4 | 5 | 6 | 7 | 8 | |
| -N+P | 0.000 | -0.528 | -0.507 | -0.779 | -0.612 | -0.736 | -0.637 | -0.876 | -0.845 |
| -N-P | 0.000 | -0.651 | -0.781 | -0.640 | -0.710 | -0.517 | -0.561 | -0.704 | -0.637 |
|
-N+P: Nitrogen starved in the presence of P-factor -N-P: Nitrogen starved in the absence of P-factor |