| 0 | 1 | 2 | 3 | 4 | 5 | 6 | 7 | 8 | |
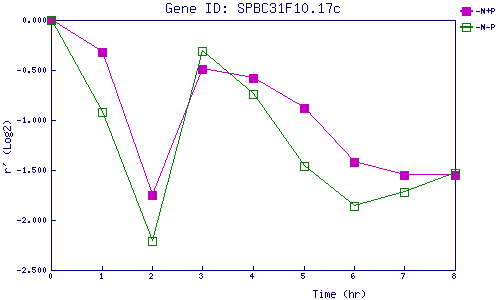
| -N+P | 0.000 | -0.321 | -1.749 | -0.490 | -0.585 | -0.882 | -1.420 | -1.554 | -1.548 |
| -N-P | 0.000 | -0.915 | -2.210 | -0.313 | -0.743 | -1.464 | -1.864 | -1.717 | -1.530 |
|
-N+P: Nitrogen starved in the presence of P-factor -N-P: Nitrogen starved in the absence of P-factor |