ste11 aff1 stex
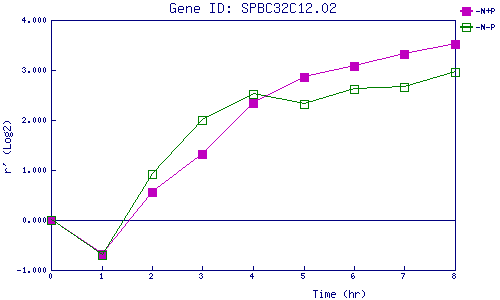
| 0 | 1 | 2 | 3 | 4 | 5 | 6 | 7 | 8 | |
| -N+P | 0.000 | -0.685 | 0.557 | 1.312 | 2.349 | 2.862 | 3.088 | 3.313 | 3.527 |
| -N-P | 0.000 | -0.709 | 0.924 | 2.007 | 2.511 | 2.316 | 2.621 | 2.664 | 2.967 |
|
-N+P: Nitrogen starved in the presence of P-factor -N-P: Nitrogen starved in the absence of P-factor |