| 0 | 1 | 2 | 3 | 4 | 5 | 6 | 7 | 8 | |
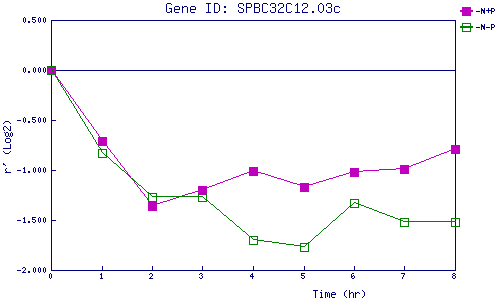
| -N+P | 0.000 | -0.706 | -1.355 | -1.205 | -1.007 | -1.172 | -1.019 | -0.988 | -0.787 |
| -N-P | 0.000 | -0.831 | -1.266 | -1.266 | -1.703 | -1.766 | -1.329 | -1.520 | -1.515 |
|
-N+P: Nitrogen starved in the presence of P-factor -N-P: Nitrogen starved in the absence of P-factor |