rec14
| 0 | 1 | 2 | 3 | 4 | 5 | 6 | 7 | 8 | |
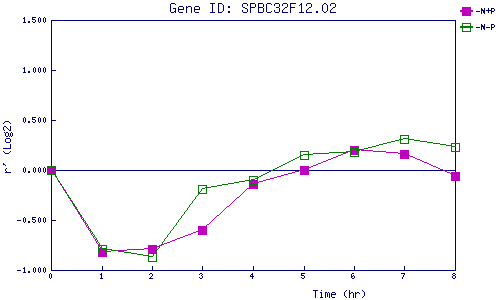
| -N+P | 0.000 | -0.825 | -0.788 | -0.595 | -0.140 | -0.001 | 0.197 | 0.155 | -0.061 |
| -N-P | 0.000 | -0.792 | -0.873 | -0.192 | -0.101 | 0.150 | 0.178 | 0.310 | 0.226 |
|
-N+P: Nitrogen starved in the presence of P-factor -N-P: Nitrogen starved in the absence of P-factor |
