tug1 gtb1
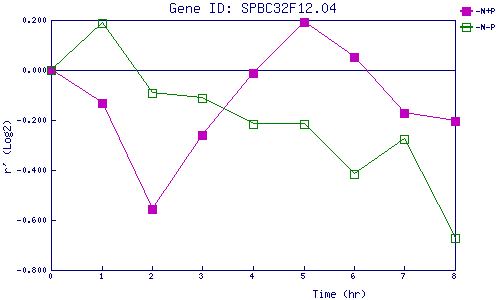
| 0 | 1 | 2 | 3 | 4 | 5 | 6 | 7 | 8 | |
| -N+P | 0.000 | -0.132 | -0.556 | -0.261 | -0.011 | 0.194 | 0.051 | -0.172 | -0.203 |
| -N-P | 0.000 | 0.188 | -0.093 | -0.110 | -0.217 | -0.217 | -0.415 | -0.275 | -0.674 |
|
-N+P: Nitrogen starved in the presence of P-factor -N-P: Nitrogen starved in the absence of P-factor |