isy1 cwf12
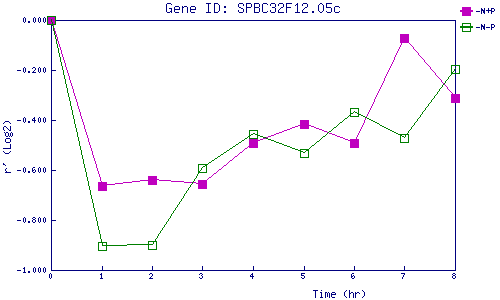
| 0 | 1 | 2 | 3 | 4 | 5 | 6 | 7 | 8 | |
| -N+P | 0.000 | -0.664 | -0.640 | -0.655 | -0.493 | -0.416 | -0.491 | -0.074 | -0.310 |
| -N-P | 0.000 | -0.902 | -0.900 | -0.592 | -0.456 | -0.532 | -0.366 | -0.471 | -0.197 |
|
-N+P: Nitrogen starved in the presence of P-factor -N-P: Nitrogen starved in the absence of P-factor |