pch1
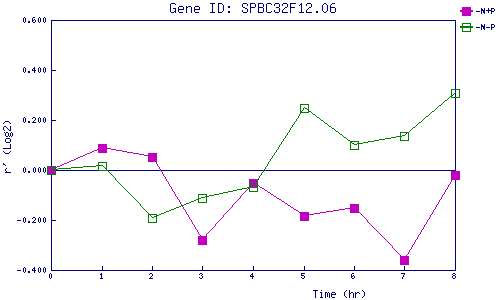
| 0 | 1 | 2 | 3 | 4 | 5 | 6 | 7 | 8 | |
| -N+P | 0.000 | 0.086 | 0.051 | -0.281 | -0.052 | -0.182 | -0.153 | -0.362 | -0.019 |
| -N-P | 0.000 | 0.018 | -0.193 | -0.112 | -0.067 | 0.246 | 0.101 | 0.134 | 0.309 |
|
-N+P: Nitrogen starved in the presence of P-factor -N-P: Nitrogen starved in the absence of P-factor |