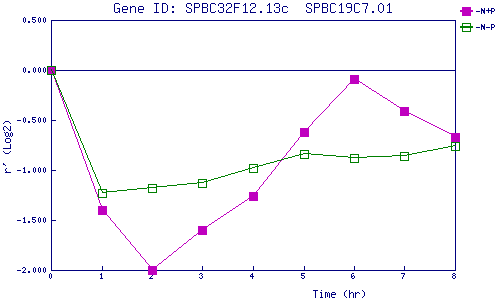
| 0 | 1 | 2 | 3 | 4 | 5 | 6 | 7 | 8 | |
| -N+P | 0.000 | -1.405 | -1.997 | -1.597 | -1.265 | -0.623 | -0.090 | -0.409 | -0.668 |
| -N-P | 0.000 | -1.232 | -1.180 | -1.133 | -0.980 | -0.837 | -0.878 | -0.855 | -0.764 |
|
-N+P: Nitrogen starved in the presence of P-factor -N-P: Nitrogen starved in the absence of P-factor |