pi021
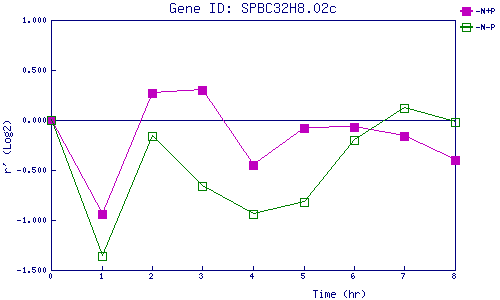
| 0 | 1 | 2 | 3 | 4 | 5 | 6 | 7 | 8 | |
| -N+P | 0.000 | -0.944 | 0.268 | 0.303 | -0.454 | -0.075 | -0.066 | -0.162 | -0.401 |
| -N-P | 0.000 | -1.355 | -0.155 | -0.660 | -0.937 | -0.823 | -0.200 | 0.123 | -0.019 |
|
-N+P: Nitrogen starved in the presence of P-factor -N-P: Nitrogen starved in the absence of P-factor |