bem46
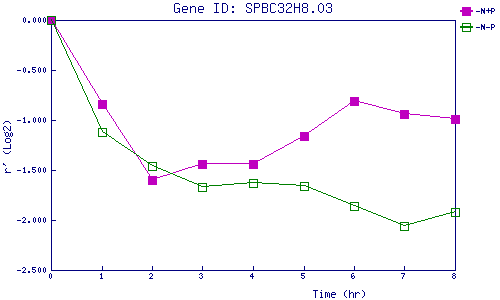
| 0 | 1 | 2 | 3 | 4 | 5 | 6 | 7 | 8 | |
| -N+P | 0.000 | -0.838 | -1.596 | -1.439 | -1.438 | -1.161 | -0.814 | -0.937 | -0.989 |
| -N-P | 0.000 | -1.119 | -1.464 | -1.668 | -1.628 | -1.662 | -1.863 | -2.064 | -1.920 |
|
-N+P: Nitrogen starved in the presence of P-factor -N-P: Nitrogen starved in the absence of P-factor |