pi019
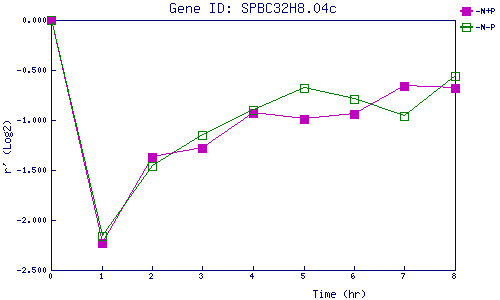
| 0 | 1 | 2 | 3 | 4 | 5 | 6 | 7 | 8 | |
| -N+P | 0.000 | -2.233 | -1.371 | -1.285 | -0.929 | -0.987 | -0.945 | -0.665 | -0.683 |
| -N-P | 0.000 | -2.158 | -1.460 | -1.146 | -0.905 | -0.680 | -0.793 | -0.961 | -0.563 |
|
-N+P: Nitrogen starved in the presence of P-factor -N-P: Nitrogen starved in the absence of P-factor |